Excel for Small Businesses: 11 Most Useful Features
Do you use Excel for your small business? Great! You could save yourself a lot of time by learning how to use Excel features more effectively. In some cases, this will mean automating repetitive tasks. And in other cases, you’ll learn to manipulate data more efficiently. In this article, we’ll go over some of the most useful features of Excel for small business needs.
Excel for Small Businesses
Do you use Excel to its full potential? This spreadsheet software can be a great tool for small business owners. If you’re not using it, you might miss out on some features that could make your life easier.
Excel is known as the tool of choice for numbers-savvy business professionals. Office workers spend 38% of their time working in Excel. They use this to do varied tasks such as data entry. Yet, there are a lot of features that are not maximized or utilized due to lack of knowledge on the tool.
So, here are some of the most useful features you can utilize: :
Most Useful Excel Features for Small Businesses
You don’t need to be a Microsoft Certified Professional to use Excel’s advanced features to their full potential. You need some familiarity with basic spreadsheet formulas and functions for using the advanced features you want to take advantage of. The following tips can help you learn how to use Excel like a pro:
1. Conditional Formatting
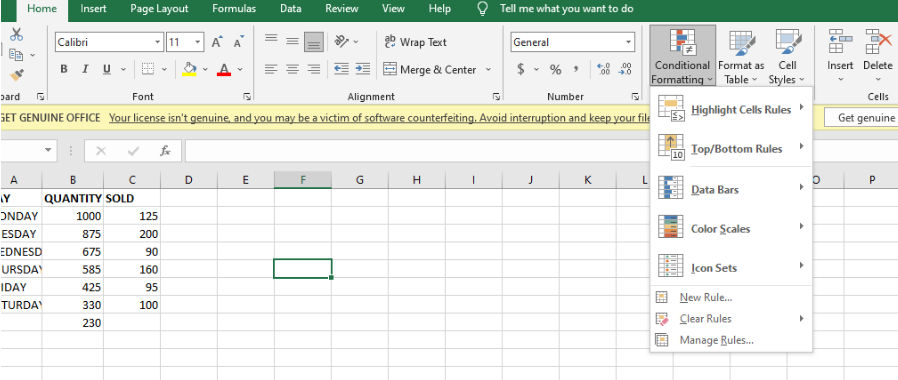
Conditional formatting is something that everyone should be using. It makes your Excel sheets more visual, and when you are using a lot of data, it makes it easier to understand if you are able to see what is important and what isn’t. Basically, it allows you to set up rules in Excel which will decide how a cell is formatted.
The program’s conditional formatting feature allows you to apply different formats to cells depending on their content. For example, you could have a “low stock” message appear any time the number of items in inventory drops below 10. The conditional formatting feature makes highlighting important information in your spreadsheets easier. To use this feature, click on the “home” tab and “conditional formatting.” You can then choose from various options, including data bars and color scales.
2. Named Ranges
A named range lets you assign a name to a cell or group of cells in Excel. This makes it easier to refer back to those cells in formulas and functions. For example, if your inventory list is in column A and your costs are in column B, you can highlight both columns and assign them names such as “inventory” and “costs.” Now you can use those names instead of the cell numbers when creating formulas or functions related to those data groups.
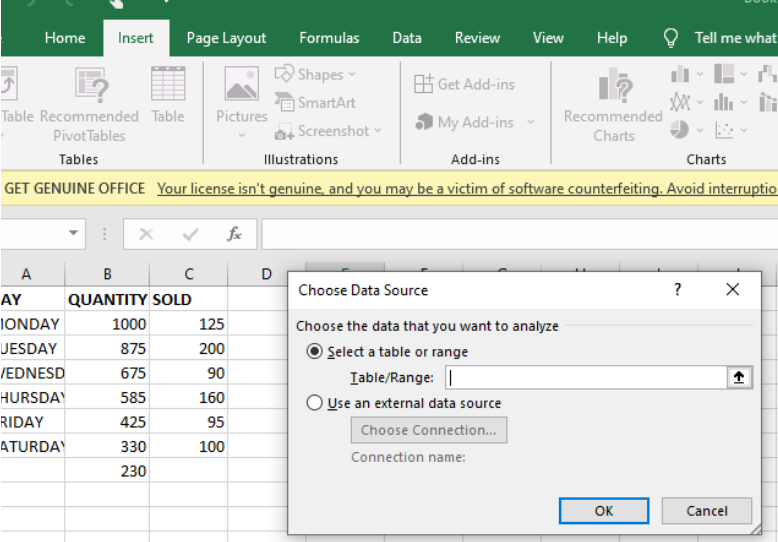
3. Pivot Tables
Pivot tables are a great way to analyze data, particularly when you have multiple columns and rows of data. For example, if you have a list of customers with their order dates, quantities, and prices, you can use the pivot table functionality in excel to quickly see the total sales by customer or by month.
4. Workbook Connections Feature
Using Excel to create reports from different sources, this feature will help you pull data from these sources into a master workbook. Doing so manually would be pretty time-consuming. You can automatically refresh your data to include any updates in minutes with this feature.
This feature also allows you to edit data in any single cell and have it update all the affected cells in your worksheet automatically. For example, you have a workbook that collects data from employees, clients, and vendors from multiple sources. With Workbook Connections, teams in the business can make connections between their workbooks without needing direct access to those workbooks. This means you can make it easier for teams to collaborate on data and insights, while maintaining control over that data. With the workbook connections feature you can easily keep track of all this information and make sure it doesn’t get lost.
5. Document Protection
Excel allows users to protect their data in many different ways. First, you can lock down an entire file with a password or even restrict the editing of individual cells. Excel also allows users to protect their files from accidental edits by enabling cell protection and sheet and workbook protection.
Password protection is useful when you want to keep your sensitive data private or you do not want someone to modify your data. The password protection feature in Excel is a free security measure that protects against cybersecurity threats and identity theft.
You must protect important documents with passwords and other controls in accounting situations so your data remains untouched.
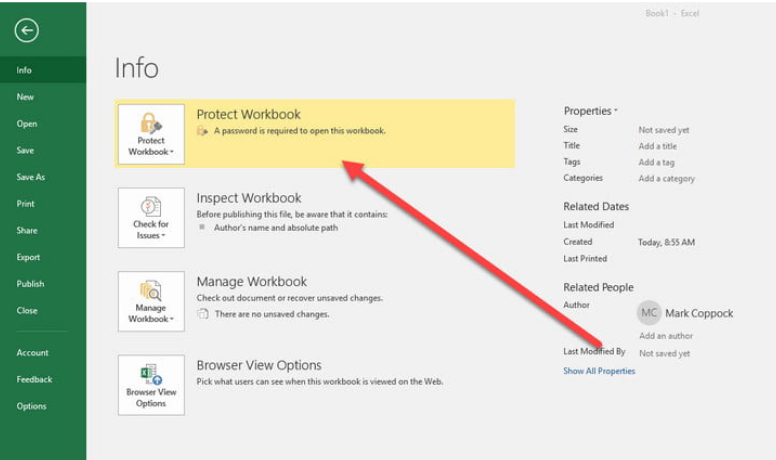
Source: https://www.digitaltrends.com/computing/how-to-password-protect-an-excel-file/
6. Sorting and Filtering
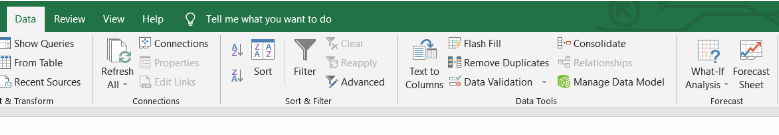
Sorting involves putting information in a specific order. It is easy to find certain data within a table or list. You can sort on a single column or on multiple columns either in ascending or descending order. For example, if you have data on sales per month, sorted by region, it is easier to figure out where the highest sales are coming from.
Filtering allows you to display only specific data that you want to see. This makes it easier for you to analyze your data further. You can filter your data by text, number, date, color, and other criteria depending on what you need from your table or list. Suppose you keep a spreadsheet of every sale your business makes. You could use filtering to look at sales from a particular day or within a certain time frame, such as a month or year.
7. What-If Analysis
This feature allows you to see how different values affect a formula. For example, suppose your company is considering two marketing strategies: one that costs $10,000 and another that costs $15,000. You want to see how these different expenditures would affect your profit. You could create two separate scenarios, but what if there are more options? With What-if Analysis, you can explore each possible marketing expenditure and see how it affects profit at once instead of going through each scenario line by line.
8. Data Validation
Excel has a data validation feature that you can use to perform checks on cell contents based on conditions you specify. The most basic use of data validation is to limit the choices available in a cell or group of cells. As an example, let’s say you’re creating a spreadsheet with a column for each month of the year, and you need to enter the number of days in each month. You can create drop-down lists for each month cell by using data validation and selecting the option limiting entries to list items. This prevents the user from entering an incorrect value.
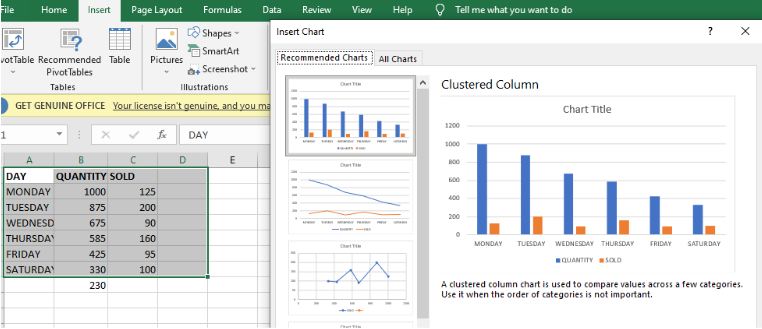
9. Charts and Graphs
Excel has tons of options for charts and graphs. There are many different types of charts, like bar charts, pie charts, line graphs, and scatter plots, just to name a few. For example, if you want to compare your monthly sales numbers over the last year, a simple bar graph will do the trick. These visualizations make it easy for you to spot trends and outliers in your data that might otherwise be overlooked.
Using these charts can help you visualize your data, making it easier to understand. And, when you use your data to create a chart or graph, Excel will update the chart if you change the data. So creating charts in Excel is easy and efficient!
10. Simple Formulas
There are many different formulas you can use in Excel. But some of the most important are also simple. You’ll probably use these most often when working with business data, so it’s worth familiarizing yourself with them.
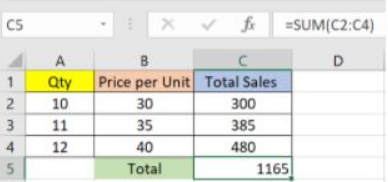
The SUM formula is probably the most fundamental in all of Excel. It adds the contents of the cells you specify, like a column of numbers. For example, if cell A1 contains the number 2 and cell A2 contains 3, then =SUM(A1:A2) will return 5.
Other simple formulas include:
AVERAGE and MEDIAN to calculate averages and medians, respectively
COUNT to count cells that meet certain criteria, for example, not empty or containing text
MAX and MIN to return the maximum or minimum values in a given range
Source: https://www.simplilearn.com/tutorials/excel-tutorial/excel-formulas
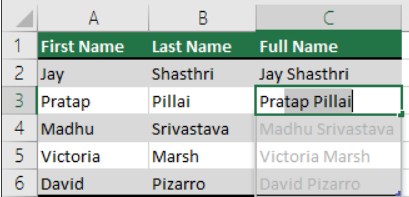
11. Flash Fill
This is one of the most useful new features of Excel. It lets you automatically fill in data based on patterns you specify in just a few clicks. For example, if you want to populate a column with full names based on first and last names in two separate columns, enter a few rows manually, then click Flash Fill. It will suggest ways to complete the rest of the rows automatically.
Benefits of Using Excel for Small Businesses
Some things you can do with Excel include:
Data Visualization
Data visualization allows you to make sense of information by presenting it graphically, whether in the form of charts, graphs, or maps. Not only can this help you digest complex sets of data more easily, but it allows you to tell a story about your business that others can understand.
Organization
Excel is great for organizing and storing data, from planning budgets and keeping track of employee vacation days to recording sales leads and tracking inventory levels at multiple locations.
Automation
Consider automating them using macros if you’re constantly performing the same tasks in Excel, such as formatting sheets or creating pivot tables. These are computer-generated commands that execute custom actions based on criteria that you set up. Macros are used across various industries to save time and reduce errors.
Bookkeeping
When you own a small business, you need to keep track of financial transactions, such as sales and payments. You can use Excel to record transactions and reconcile your bank statements.
Inventory Tracking
If you own a store or restaurant, you’ll need to track your inventory. You can use Excel to record inventory stock levels and order quantities. You can also create an inventory report that will make using Excel worthwhile.
Prepare a Budget
You can use Excel to create a budget for your business. You can compare actual sales results against your original estimates and adjust to the following year’s budget if you’ve been in business for at least one year.
Collaboration
A benefit of using Excel for small businesses is that it allows users to collaborate on workbooks even when they’re working remotely.
In Conclusion
Work smarter with Excel for small businesses, like creating tables and using formulas. Use pivot tables and find the average, minimum and maximum values in your data. As a business owner, you probably have valuable insights that would help you streamline your business processes.

Ultimate Website Design Secrets Blackbook
Insider secrets and simple tweaks you can make
to your website today that will make a huge
impact on your bottom line …